Helical Insight is an embeddable open source BI product providing a unified BI experience i.e.

  • Paginated pixel perfect printer friendly reports (similar to SSRS, crystal reports etc)
  • AI assisted chat driven analytics
  • Interactive dashboards with drill down drill through (similar to Tableau)

In this getting started, we are providing a quick walkthrough of application along with relevant hyperlinks for more detailed reading.
Login Form

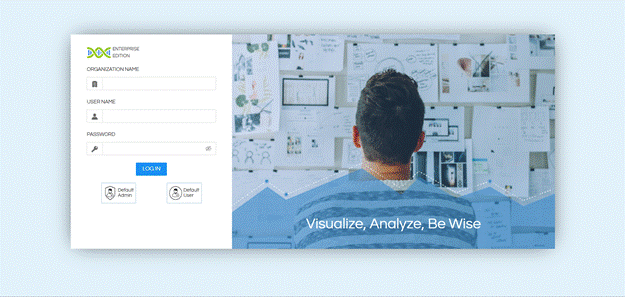
Once you have installed Helical Insight BI product, you will see the login page. The Login Form is used to authenticate users before accessing Helical Insight.

Field Description
Organization Name Specifies the organization or tenant the user belongs to.
User Name The registered username for the account.
Password The account password. The eye icon allows users to show or hide the password.
Log In Authenticates the entered credentials and grants access to the application.

Quick Login Options

The Quick Login Options provide shortcuts for logging in with predefined accounts, mainly for demonstration or initial setup.

Option Description
Default Admin Logs in with the default superadmin account, providing access to administrative features.
Default User Logs in with a standard user account, allowing access to reports and dashboards with regular user permissions. Read more here.

Getting Started with Helical Insight

Helical Insight Home Page

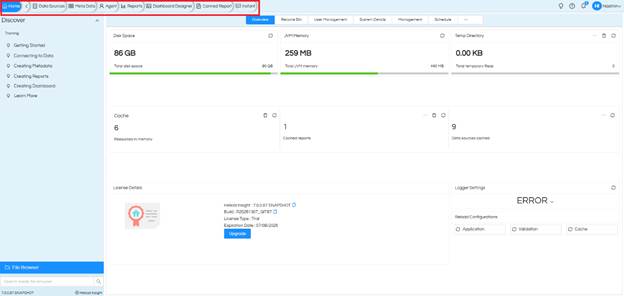
The Home Page is the landing page displayed after a successful login. It provides quick access to system information, administration tools, training resources, file repository, admin related activities (incase if you have logged as admin).

Getting Started with Helical Insight

Helical Insight home page overview

Navigation Ribbon & Modules

Click the arrow (>) beside the Home button to expand the Navigation Ribbon. This ribbon provides quick access to all major Helical Insight modules, allowing users to create data connections, build metadata & AI agent, design interactive charts (reports and dashboards), using AI chat driven analytics, and create pixel perfect paginated reports (Canned Report). Entire product is built with simple drag drop interaface, allowing non technical users also to use it. For more advanced control, there are even options of writing SQL, HTML CSS JS, groovy code, Java code etc as well as use APIs (every functionality is supported by API, allowing extensive automation).

Getting Started with Helical Insight

Navigation ribbon

Home

Returns you to the Helical Insight Home page, where you can access system administration, repository management, and product overview.

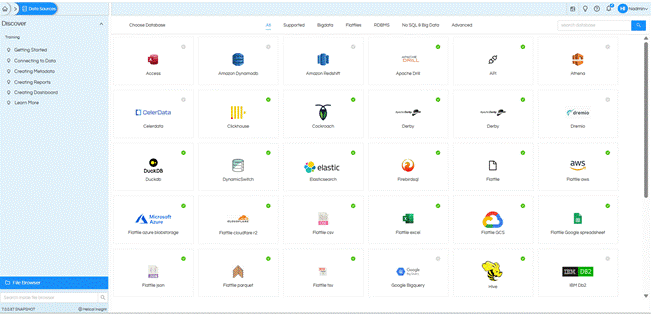
The Data Sources module is used to create and manage connections to databases, cloud platforms, flat files, APIs, and big data technologies. Read more here.

Data Sources

The Data Sources module is used to create and manage connections to databases, cloud platforms, flat files, APIs, and big data technologies. Read more here.

Getting Started with Helical Insight

Meta Data

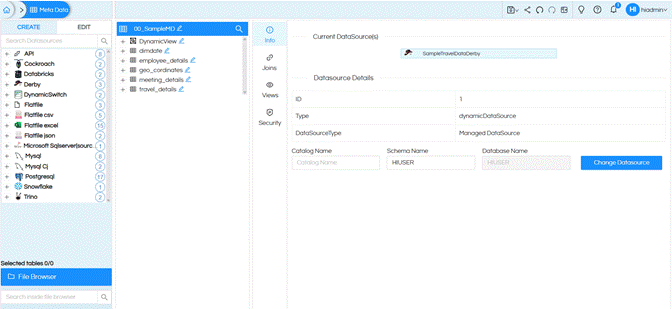
The Metadata module lets you build a semantic layer over your data. Instead of exposing raw database tables directly to users, you can create a business-friendly data model with joins, views, calculated fields, and security rules. The metadata module is in turn used to drag and drop and create reports (charts/visualizations) as well as used by Agent layer. Read about metadata here.

Getting Started with Helical Insight

Agent

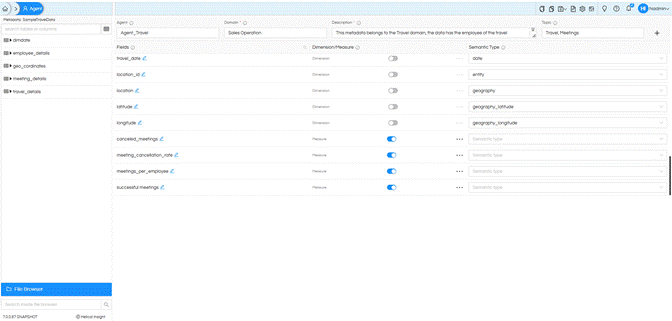
The Agent module allows us to create a semantic models (on top of previously created metadata) that enable users to query data using natural language. Agents define the business context and metadata required for Instant BI. Read here how to create agents.

Getting Started with Helical Insight

Agent Module

Reports

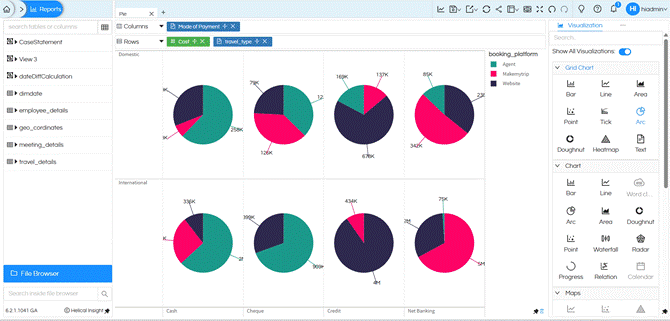
Report module provides a very simple drag-and-drop interface for building widgets/reprots which can be of various type (like table, cross, charts, visualization, map etc). Then via UI you can add drill down drill through. Via Properties option you can change the look & feel, styling properties of the created analysis. self-service reports and visualizations without writing SQL. Click here to learn how to use the self service report designer module.

Getting Started with Helical Insight

Report Designer

Dashboard Designer

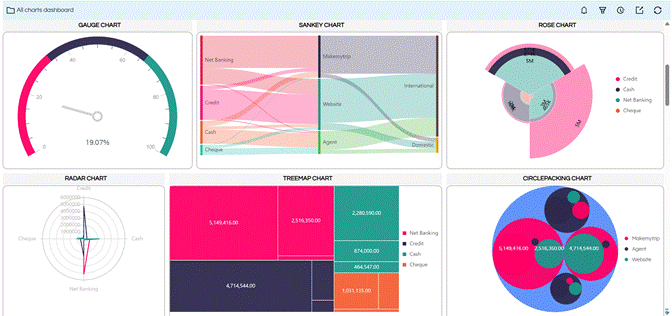
The standalone widgets created using the “Report” module (covered above) can now be used in the dashboard designer module to create dashboard. Using simple drag drop you can drag panels, resize, reposition, add filters, change look and feel (header, shadow, border, background etc), add HTML CSS, add text images tabbed view etc and create fully functional dashboard. Click here to learn how to use dashboard designer module.

Getting Started with Helical Insight

Dashboard Designer

Canned Report

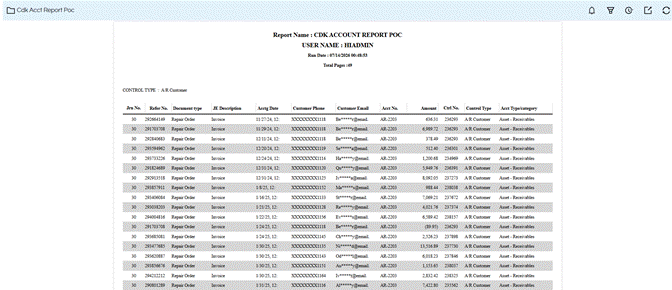
Canned report module is helpful for creating pixel perfect multi pager document kind of reports (with things like header, footer, summary, cover page etc) which can also be exported in various formats (like PDF Excel CSV Text ODT etc). Some examples of canned reports are bank statement, salary slips, P&L statement etc. Canned report module is similar to tools like SSRS, Crystal Reports etc. Click here to learn about the usage of canned reports.

Canned Reports

Instant BI

Instant BI (introduced from version 7.0) is an AI-powered conversational analytics module allowing users users to ask questions in natural language and receive charts, tables, and business insights instantly with no technical knowledge required. We are providing an option to bring your own LLM and use it. Click here to learn how to use Instant BI module.

Home Page Options

On the home page, after logging in, below are the functionalities.

Top Navigation Bar

On the The top bar provides quick access to common actions and user settings.

Option Description
Home Returns to the Home page.
Notifications Displays system alerts and notifications.
Help Opens product help and documentation.
User Profile Displays the logged-in user and provides profile and logout options.

Canned Reports

Top navigation bar

Left Navigation Panel

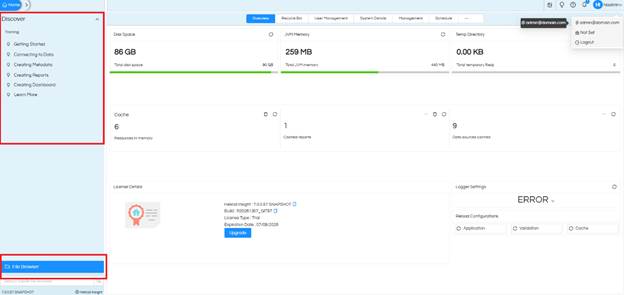
Discover

Provides various learning resources and product guides for new users.
Canned Reports

Left navigation panel — Discover

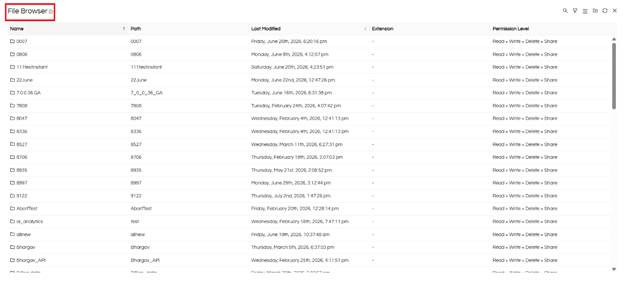
File Browser

Displays the repository containing reports, dashboards, metadata, data sources, and other project files. It also includes a search box to quickly locate repository items — you can even search by file name from the search bar below the file browser. Read in detail about file browser operations here.
Canned Reports

Administration Tabs

These tabs provide access to different administrative functions.

System Overview Widgets

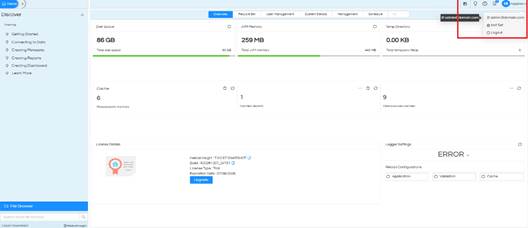
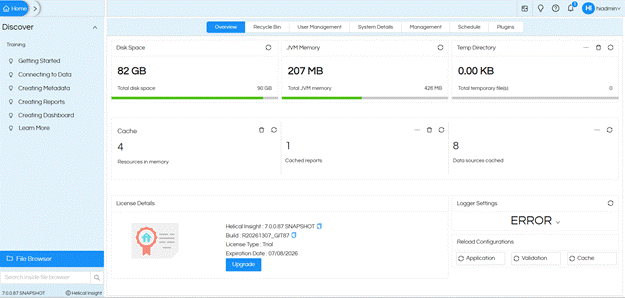
The Overview tab displays various real time statistics like the JVM memory, cache, disk space etc. Read in detail about it here.

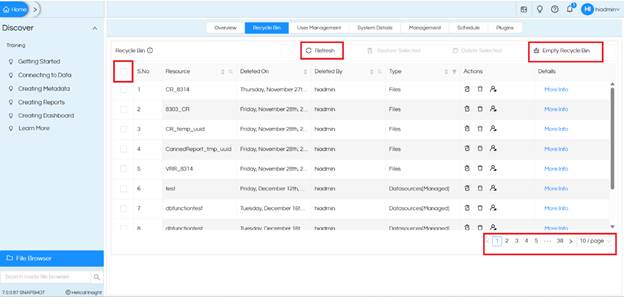
Recycle Bin

Recycle bin module is helpful to recover deleted resources, or change ownership level while restoring or permanently delete them. Read here about recycle bin operations.
Canned Reports

Recycle Bin

User Role Management

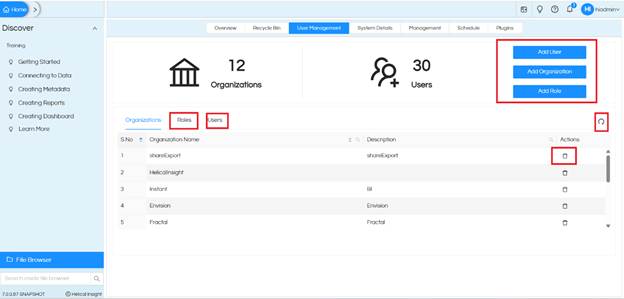
User Management
Canned Reports

user management

Helical Insight is a multi-tenant application with proper user role management (organization, various prebuilt roles and custom roles options, user/username, various kind of profile attributes and profile values). Learn more about the user role management here.
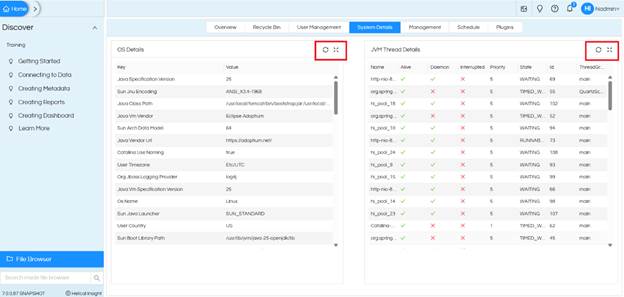
System Details

System details will be shown here like OS, JVM etc of the server on which Helical Insight is installed.

Canned Reports

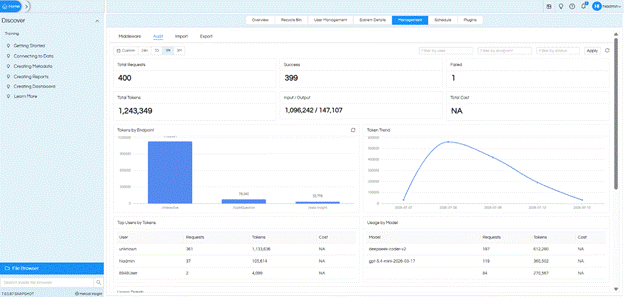
Management

Canned Reports

Management panel

Module Description
Middleware Enable/Disable middleware integration.
Audit View AI/API usage, token consumption, requests, trends, and model statistics.
Import / Export This is useful to migrate built solution from one server to another. Click here to learn more.

Schedule

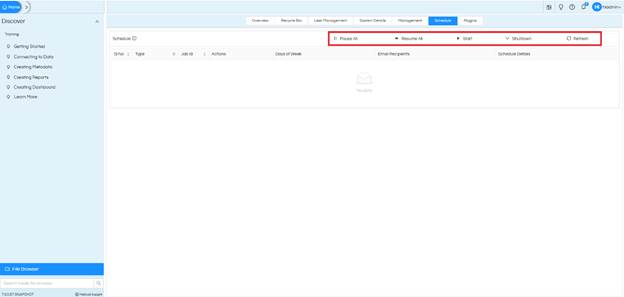
Helical Insight comes with support of email scheduling/report bursting and here we can see the various schedules, perform admin kind of operations.

Canned Reports

Schedule

Plugins

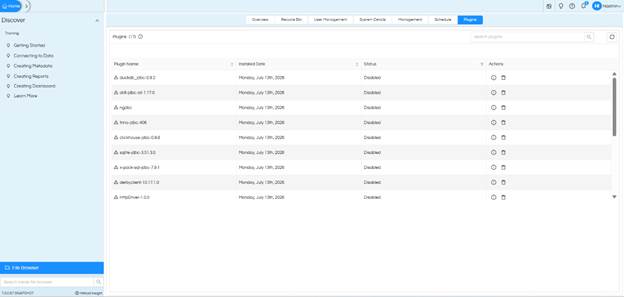
Plugin section contains the list of all the DB drivers which are installed. If some driver are to be removed those can be removed from here.

Canned Reports

Plugins

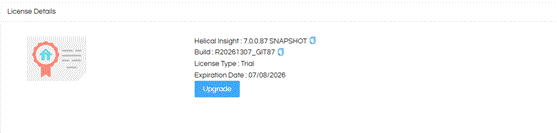
License Details

This displays information about the license, build number, expiry etc.
Canned Reports

License details

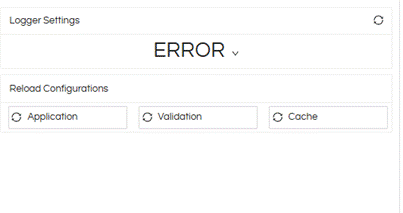
Logger Settings

Displays the current application logging level (such as ERROR, INFO, or DEBUG) used for troubleshooting and monitoring.
Canned Reports

Logger settings

Reload Configurations

Allows administrators to reload specific application configurations without restarting the server. These options help apply configuration changes quickly while minimizing downtime.

Embedding & SSO Options

Any analysis created with Helical Insight, i.e. paginated canned report or interactive dashboard or chat based conversational analysis, can be embedded. We support various kind of embedding, white labelign and SSO options.

Embedding: There are couple of different embedding options we support like sessionless< (javascript_ method of embedding (most preferred), iFrame method of embedding, object tag method of embedding, embed tag method of embedding.

Single Sign On: When embedding is done, there is support of Single Sign On which helps in making sure that session is in sync with the parent application. When SSO is enabled, the user role management is also in sync with the parent application. There are various kind of SSO options that are supported like JWT, oAuth, Okta, SAML etc. If you are using a custom token, there is also a custom token based SSO method as well.

Need Help?

You can reach out to us on support@helicalinsight.com or Register for a personalized demo, help with your questions, help with any sort of evaluation and usage. You can also make use of forum for raising questions.

Contact Support

Leave a Reply

Helical Insight’s self-service capabilities is one to reckon with. It allows you to simply drag and drop columns, add filters, apply aggregate functions if required, and create reports and dashboards on the fly. For advanced users, the self-service component has ability to add javascript, HTML, HTML5, CSS, CSS3 and AJAX. These customizations allow you to create dynamic reports and dashboards. You can also add new charts inside the self-service component, add new kind of aggregate functions and customize it using our APIs.
Helical Insight, via simple browser based interface of Canned Reporting module, also allows to create pixel perfect printer friendly document kind of reports also like Invoice, P&L Statement, Balance sheet etc.
If you have a product, built on any platform like Dot Net or Java or PHP or Ruby, you can easily embed Helical Insight within it using iFrames or webservices, for quick value add through instant visualization of data.
Being a 100% browser-based BI tool, you can connect with your database and analyse across any location and device. There is no need to download or install heavy memory-consuming developer tools – All you need is a Browser application! We are battle-tested on most of the commonly used browsers.
We have organization level security where the Superadmin can create, delete and modify roles. Dashboards and reports can be added to that organization. This ensures multitenancy.
A first-of-its-kind Open-Source BI framework, Helical Insight is completely API-driven. This allows you to add functionalities, including but not limited to adding a new exporting type, new datasource type, core functionality expansion, new charting in adhoc etc., at any place whenever you wish, using your own in-house developers.
It handles huge volumes of data effectively. Caching, Pagination, Load-Balancing and In-Memory not only provides you with amazing experience, but also and does not burden the database server more than required. Further effective use of computing power gives best performance and complex calculations even on the big data even with smaller machines for your personal use. Filtering, Sorting, Cube Analysis, Inter Panel Communication on the dashboards all at lightning speed. Thereby, making best open-source Business Intelligence solution in the market.
With advance NLP algorithm, business users simply ask questions like, “show me sales of last quarter”, “average monthly sales of my products”. Let the application give the power to users without knowledge of query language or underlying data architecture
Our application is compatible with almost all databases, be it RDBMS, or columnar database, or even flat files like spreadsheets or csv files. You can even connect to your own custom database via JDBC connection. Further, our database connection can be switched dynamically based on logged in users or its organization or other parameters. So, all your clients can use the same reports and dashboards without worrying about any data security breech.
Our application can be installed on an in-house server where you have full control of your data and its security. Or on cloud where it is accessible to larger audience without overheads and maintenance of the servers. One solution that works for all.
Different companies have different business processes that the existing BI tools do not encompass. Helical Insight permits you to design your own workflows and specify what functional module of BI gets triggered